Charts show Stock
Market Over-Valuation and Divergences
By the Curmudgeon with Victor
Sperandeo
Disclaimer:
Equity index valuations are not meant
to be used for stock market timing. The stock market can stay overvalued for
many years or decades, like from 2011 to today. Conversely, they can be
severely undervalued for long periods of time, e.g. from December 1974 to
August 1982.
Over-Valuation Charts (courtesy of Elliott Wave International):
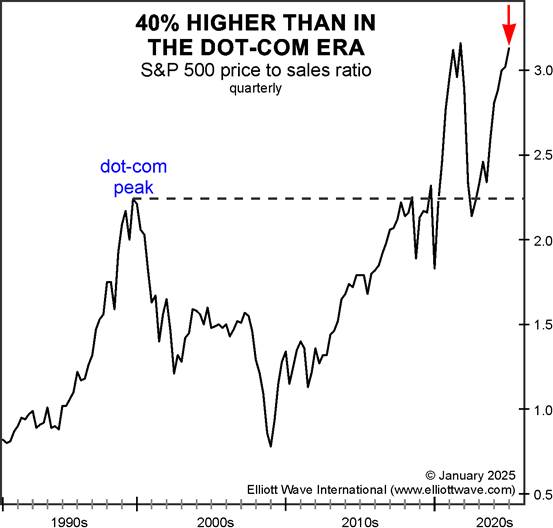
The chart below shows that the
S&P 500 price-to-sales ratio is 3.1, meaning that investors are willing to
pay over $3 for every dollar of sales generated by the index’s companies. This
is 40% higher than at the end of the dot-com boom in 2000:
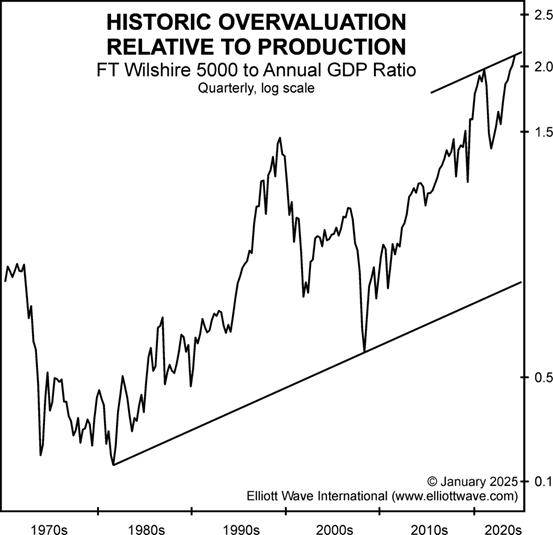
The next chart below shows another
key valuation ratio: the FT Wilshire 5000, the broadest measure of U.S. stock
market performance, relative to annual U.S. GDP. The current ratio is 2.05, a
record extreme over the past half century.
The most recent important
development is the ratio’s intersection with the resistance line of its long-term
channel. The channel starts at the key low in August 1982 and connects to the
low in March 2009. These are two of the most memorable low points for stock
prices and were great buying opportunities.
The top channel line comes off the
extreme in December 2021, the month between the highs in the NASDAQ indexes and
the Dow and S&P 500:
The next chart below, combining
multiple metrics, shows that the current stock market is more over-valued than
at any time since 1929 market top and we know what happened after that. :-((
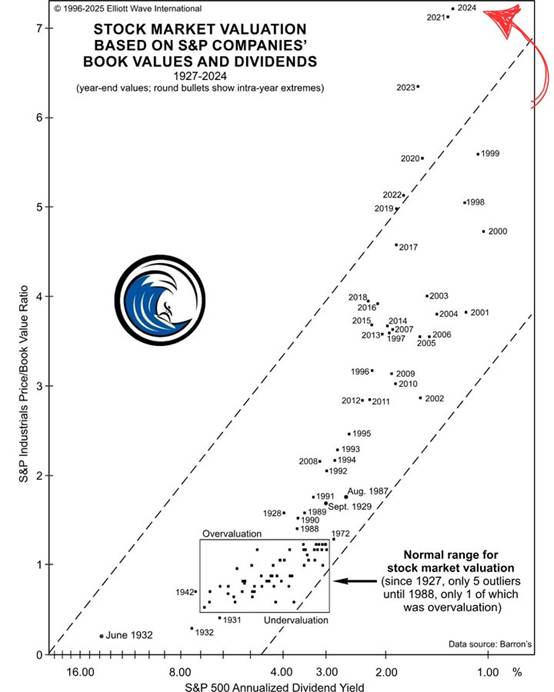
The last over-valuation chart
depicts the history of year-end valuations for stocks of S&P companies on
two bases: price to book value (Y axis) and dividend yield (X axis).
Elliott Wave International’s Robert Prechter thought the year-end 2021 overvaluation would never
be surpassed. But as you can see, the year-end 2024 reading is both higher and
further to the right. It is the highest multiple ever recorded for S&P
Industrials' price to book value and the fifth-lowest level for the S&P
Composite’s dividend yield, the four lower readings all occurring in 1998-2001.
….…………………………………………………………………………………..
Courtesy of Tom McClellan,
here’s a chart showing a key divergence between the S&P 500 and the NYSE
Advance/Decline line:
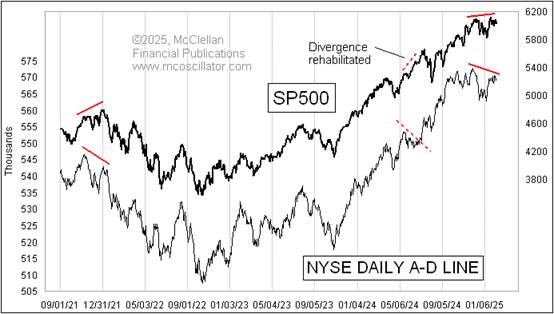
McClellan
notes that such divergences are typically seen at the end of bull markets and
are sometimes “rehabilitated” like in mid-2024.
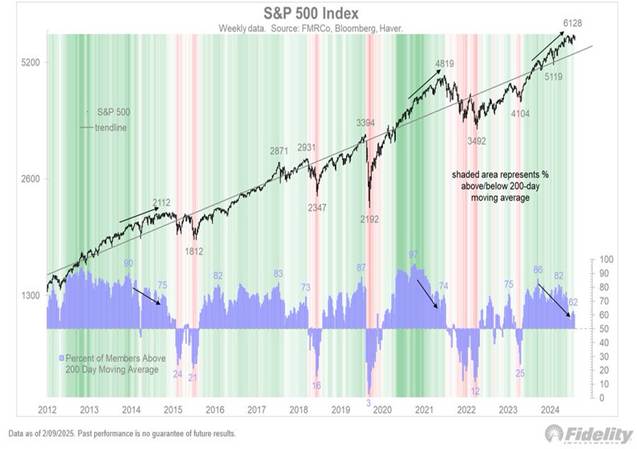
Fidelity’s Jurrien Timmer says the current 28-month cyclical bull market in
U.S. equities remains. Yet only 62% of stocks are above their 200-day moving
average, and the chart below shows a series of negative divergences, the likes
of which tend to happen in the more mature stages of bull markets.
The Curmudgeon adds that the
current equity bull market has occurred during an on-going 4+ year old BEAR
market in U.S. bonds and notes with the yields on both the 10 and 30 year U.S.
Treasuries higher and prices lower than in each of the last four years. Please refer to: Curmudgeon/Sperandeo: U.S.
Budget Deficits, Debt and the Return of Bond Vigilantes (01/27) for more
details.
Victor’s Comments:
The
charts above depict stock market risk that keeps getting worse and worse over
time. Let me try to explain why this has happened.
1. If wealth managers keep
money in cash or T-Bills, they usually won’t receive a management fee. Thereby, investment money primarily flows
into stocks. As we’ve pointed out in
numerous Curmudgeon posts, huge budget deficits have resulted in a
supply-demand imbalance, which along with the perception of sticky inflation
and falling prices has limited money flows into U.S. bonds.
2. The U.S. government
spends huge quantities of fiat “printed” paper money which finds its way into
U.S. equities. That has resulted in
extreme overvaluation and thereby great degrees of risk!
3. Most U.S. laws are
lobbied to benefit the top 10% of net worth people, and institutions. Stock
buybacks, for example, mainly help corporate insiders/executives while
restricting economic growth. That, in turn, exacerbates over-valuation of
equities as earnings per share are artificially inflated due to the lower
supply of stock outstanding.
4. Allowing 50% margins to
buy stocks has contributed to rising margin debt and higher stock prices. So do leveraged long ETFs. Meanwhile, banks charge 20% to 24% interest
on credit cards for people who need to use them to pay for living expenses!
5. The Federal Reserve is a
very complex institution with very arcane rules not understood by most folks.
The people who study this have a large edge in life than a layman. The common
man is the one who always gets taken advantage of. It also must be emphasized that FOMC board members
are appointed with ONLY “Keynesians” allowed! Those economists are always for
money printing, which causes P/Es of 35 or more in favored U.S. equities like
the Magnificent 7. That wouldn’t happen
if FOMC members were “Free Market” economists.
An Important Book for Stock
Market Participants:
The
never talked about, secret reason for stock market over-valuation was best
expounded by a little known “card mechanic” (cheat) who wrote a book in 1902
titled, “The Expert at the Card Table,” by S.W. Erdnase. It’s an
expose on how to use sleight of hand to cheat at cards.
In the
Preface, Erdnase explains:
“In
offering this book to the public the writer uses no sophistry as an excuse for
its existence. The hypocritical cant of reformed (?) gamblers, or whining,
mealy-mouthed pretensions of piety, are not foisted as a justification for
imparting the knowledge it contains. To all lovers of card games, it should
prove interesting, and as a basis of card entertainment it is practically
inexhaustible. It may caution the unwary who are innocent of guile, and it may
inspire the crafty by enlightenment on artifice. It may demonstrate to the tyro
that he cannot beat a man at his own game, and it may enable the skilled in
deception to take a post-graduate course in the highest and most artistic
branches of his vocation. But it will not make the innocent vicious, or
transform the pastime player into a professional; or make the fool wise, or
curtail the annual crop of suckers; but whatever the result may be, if it
sells it will accomplish the primary motive of the author, as he needs the
money.”
…………………………………………………………………………………………
Victor’s Conclusion:
The key
takeaway are these words, “It may demonstrate to the tyro that he cannot beat a
man at his own game, and it may enable the skilled in deception to take a
post-graduate course in the highest and most artistic branches of his vocation.
But it will not make the innocent vicious or transform the pastime player into
a professional; or make the fool wise, or curtail the annual crop of suckers.”
That is
the essence of stock market over-valuation.
The annual crop of investors, speculators, and gamblers never seem to change
their greedy human nature. As a result,
they create very bad investments/speculations but will pay the price in the end
as it always ends badly.
…………………………………………………………………………………………
Be healthy, stay calm and
content. Till next time……
The Curmudgeon
ajwdct@gmail.com
Follow the Curmudgeon on Twitter @ajwdct247
Curmudgeon is a retired investment professional. He has been involved in financial markets since 1968 (yes, he cut his teeth on the 1968-1974 bear market), became an SEC Registered Investment Advisor in 1995, and received the Chartered Financial Analyst designation from AIMR (now CFA Institute) in 1996. He managed hedged equity and alternative (non-correlated) investment accounts for clients from 1992-2005.
Victor Sperandeo is a historian, economist and financial innovator who has re-invented himself and the companies he's owned (since 1971) to profit in the ever changing and arcane world of markets, economies, and government policies. Victor started his Wall Street career in 1966 and began trading for a living in 1968. As President and CEO of Alpha Financial Technologies LLC, Sperandeo oversees the firm's research and development platform, which is used to create innovative solutions for different futures markets, risk parameters and other factors.
Copyright © 2025 by the Curmudgeon and Marc Sexton. All rights reserved.
Readers are PROHIBITED from duplicating, copying, or reproducing article(s) written by The Curmudgeon and Victor Sperandeo without providing the URL of the original posted article(s).