Big Tech Stocks Outperform; Stocks vs Bonds; a
Perma-Bear’s Warning
By the
Curmudgeon
The Beat Goes On:
We’ve noted in many recent Curmudgeon posts that this year's
stock market rally has been led by just a few big tech names. AI darling Nvidia (NVDA) has accounted for nearly
one-third of the S&P 500's gains this year.
As of the close on June 24th, Apple (AAPL), Alphabet (GOOG,
GOOGL), Microsoft (MSFT), Amazon (AMZN), Meta (META), and Broadcom (AVGO) had
also contributed more than a quarter of the S&P’s gains in 2024.
The DJI (3.77% YTD) and Russell 2000 (-0.23% YTD) were both
down on June 25th, but big tech rallied strongly. That boosted the
NASDAQ which rose +1.26%. Also, NVDA
closed +6.76%, GOOG +2.65%, META +2.34%, MSFT +0.73%, while other big tech
stocks also rallied today.
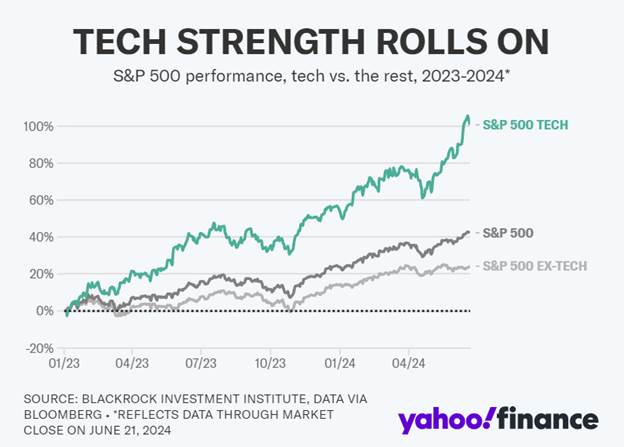
Outperformance in quarterly results from large-cap tech
continues to be a reason why earnings for the S&P 500 are growing year over
year. Investors have gorged on large-market-cap stocks that have held up well
in the higher rate environment and are seeing earnings grow more than their
smaller peers. Big tech outperformance
is clearly depicted in the chart below:
Don’t Worry About Narrow Breadth???
Morgan Stanley's chief investment officer, Mike Wilson, found
that only 20% of the top 500 stocks are outperforming the broader index over a
rolling one-month period. This is the lowest
percentage of companies outperforming in Wilson's dataset dating back to 1965.
"Narrow breadth can persist but it's not necessarily a
headwind to forward returns in and of itself," Wilson said. "We
believe broadening is likely to be limited to high quality/large cap pockets
for now."
Cartoon of the Week:
Cartoon
courtesy of Hedgeye
……………………………………………………………………………………………………..
U.S. Stock vs Bond Index
Returns:
Another recurring theme this year has been stocks rising
strongly while U.S. Treasury notes and bond prices have fallen. The outperformance of stocks over bonds
since 2009 is even more striking.
According to Dow
Jones Market Data via the Wall Street Journal, the S&P 500 has logged a
total return of more than 980% since U.S. stocks bottomed in March 2009. Contrast
that to the Bloomberg U.S. Aggregate Bond index’s total return of only 50% over
the same period.
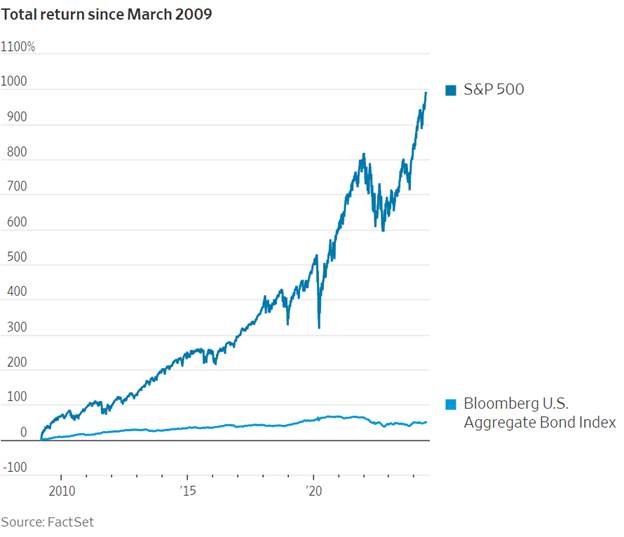
àThat means stocks have returned 19.6 times the total
return on bonds for the last 15 years and 3 months! That’s a big WOW!
A Perma-Bear Rings the
Bell at the (Presumed) Top:
In his latest market commentary (June 24th), self-proclaimed
Perma-Bear John
Hussman wrote (emphasis added):
“The main reason I have not advocated a constructive stance
since 2021 is that market internals have
remained divergent throughout this period, valuations remain beyond 1929
and 2000 extremes, and my view remains that the period since 2021 comprises the
extended top formation of one of the three great
speculative bubbles in U.S. (stock market) history.”
“Based on the present combination of extreme valuations,
unfavorable and deteriorating market internals, and a rare preponderance of
warning syndromes in weekly and now daily data, my impression is that the speculative market advance since 2009 ended
last week. Barring a wholesale shift in the quality of market internals,
which are quickly going the wrong way, any further
highs from these levels are likely to be minimal. In contrast, current
valuation extremes imply potential
downside risk for the S&P 500 on the order of 50-70% over the
completion of this cycle.”
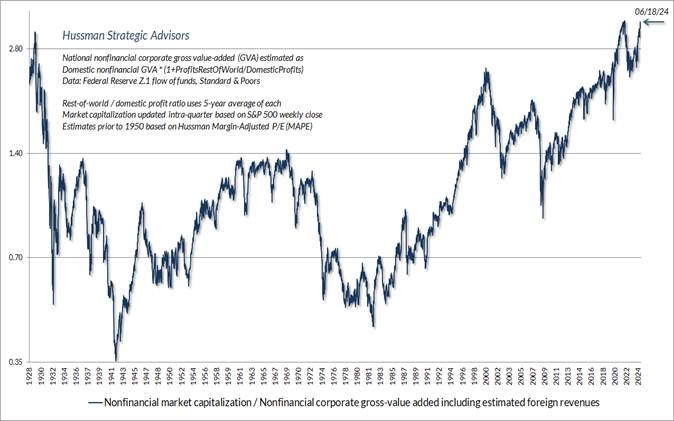
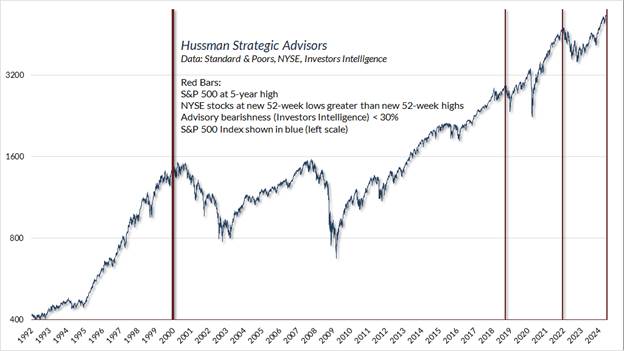
The chart below shows Hussman’s most reliable gauge of market valuations, based on correlation
with actual subsequent S&P 500 total returns in market cycles across
history. The chart shows the ratio of nonfinancial market capitalization to
gross value-added, including estimated foreign revenues. The present level
exceeds both the 1929 and 2000 extremes and is higher than every point in
history except for five weeks surrounding the January
2022 market peak.
Here’s something you don’t see very often: a 5-year high in the S&P 500 with
negative leadership (more stocks at new 52-week lows than new highs),
particularly coupled with very little bearish sentiment. That combination, as
simple as it seems, is an indication of trouble under the surface. We saw this
one on Monday, June 17th.
“In sum, a simplified way to understand our market outlook is
that valuations inform our long-term and full-cycle views, market internals
inform our intermediate term views, and a boatload of weekly and daily
syndromes relating to overextension, compression, phase transition, and reversal
inform our near-term views. I don’t think it’s generally possible to identify
market peaks and troughs in real-time, but there are unusual points in history
when one observes a sudden deluge of conditions that suggest a speculative
climax or risk-averse capitulation. Our investment discipline is to align our
outlook with observable, identifiable, quantifiable measures, and no forecasts
are required. It’s just that every now and then, those observable measures
arrive by the bucketful.”
“Even a speculative peak would not necessarily imply
immediate market losses. Both the closing and intraday peaks of the tech bubble
occurred on March 24, 2000, followed by a steep initial decline. But the
S&P 500 clawed its way to nearly the same level by September 1, 2000, and
slightly exceeded the March 24, 2000 high on a total
return basis. Likewise, the “motherlode” of warning flags we observed in
November 2021 was followed by an initial decline, but the closing high of the
S&P 500 occurred several weeks later, on January 3, 2022, at a level about
1.1% above the late-November intra-day high.”
………………………………………………………………………………………………….
Be well, stay calm,
success and good luck. Till next time…….
The Curmudgeon
ajwdct@gmail.com
Follow the Curmudgeon on Twitter @ajwdct247
Curmudgeon is a retired investment professional. He has been involved in financial markets since 1968 (yes, he cut his teeth on the 1968-1974 bear market), became an SEC Registered Investment Advisor in 1995, and received the Chartered Financial Analyst designation from AIMR (now CFA Institute) in 1996. He managed hedged equity and alternative (non-correlated) investment accounts for clients from 1992-2005.
Victor Sperandeo is a historian, economist and financial innovator who has re-invented himself and the companies he's owned (since 1971) to profit in the ever changing and arcane world of markets, economies, and government policies. Victor started his Wall Street career in 1966 and began trading for a living in 1968. As President and CEO of Alpha Financial Technologies LLC, Sperandeo oversees the firm's research and development platform, which is used to create innovative solutions for different futures markets, risk parameters and other factors.
Copyright © 2024 by the Curmudgeon and Marc Sexton. All rights reserved.
Readers are PROHIBITED from duplicating, copying, or reproducing article(s) written by The Curmudgeon and Victor Sperandeo without providing the URL of the original posted article(s).