Are U.S. Equity Markets Bullish
or Bearish?
By the
Curmudgeon with Victor Sperandeo
Market Review and Analysis:
The equity markets were relatively quiet last week. For
example, the S&P 500 (SPY ETF) adjusted close on June 18th (at
an all-time high) was 548.49 vs 544.51 on Friday June 21st. That was
a mere -0.73 point (73 bps) decline. This is bullish action according to
Victor, who still expects a big rally in July.
Victor explained why he’s bullish in this recent Sperandeo/
Curmudgeon post: “Money is flowing into U.S. stocks from debt,
because deficit spending benefits corporate earnings (and thereby stock prices)
while adding to price increases.”
The
Curmudgeon is much more cautious. While the S&P and NASDAQ are making all-time
highs, the NYSE Composite peaked in mid-May and is currently 2.17% below that
level (top panel in the chart below). The NYSE A/D line, which should be
rising, is in a slight downtrend (bottom panel).
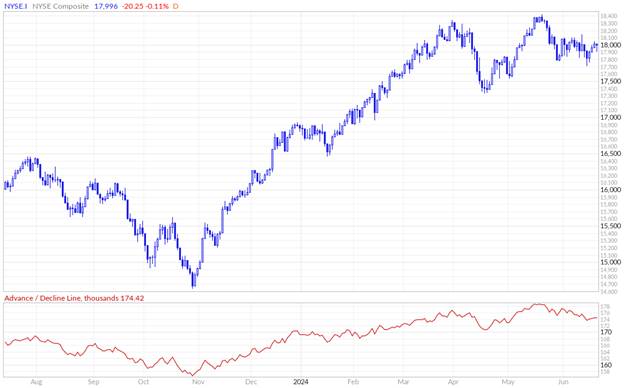
Chart
Courtesy of marketinout.com
………………………………………………………………………………………………………
While the popular averages have been making new highs
almost every week since May, the number of stocks above their 50 day and 200
day Moving Averages (MA’s) has declined. That’s shown in the bottom panel of
the chart below:
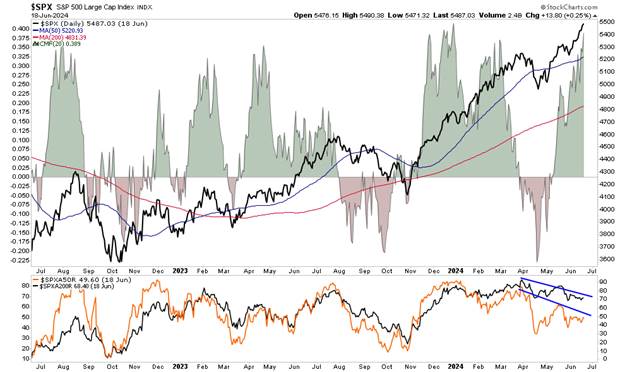
Chart Courtesy of stockcharts.com
…………………………………………………………………
Sentimentrader.com
recently released an illuminating report on the lack of volatility in the U.S.
stock market:
“It’s been nearly a year and a
half since the S&P 500 suffered a 2% daily loss. While it has gone much
longer without a big loss, returns have been muted by the time it gets to this
point. The index recorded more than 50 new highs during this stretch, a level
of performance matched only twice since 1928.”
As noted in several recent
Curmudgeon posts (here and here), the VIX
volatility index has been historically low for quite some time. It closed on
Friday at 13.2.
Here’s a long-term eye-popping chart of the VIX
vs the S&P 500:
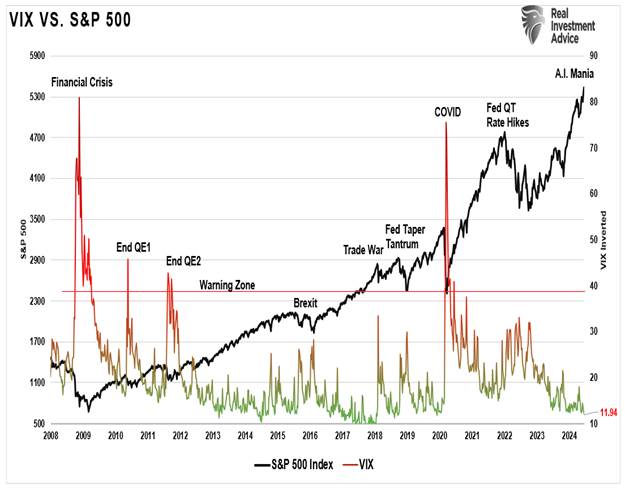
Implication: The current prolonged ultra-low volatility indicates a
high level “complacency” with investors. The longer the market moves higher
without a significant correction, the more confident investors become. They
respond by raising their allocations to equities (risk-on) and reducing their allocations
to cash (safety or risk-off assets).
Sentimentrader
concluded:
“When we get to this stage,
Wall Street is only too happy to supply the market with all kinds of products
to capitalize on investors’ regrets for the recent past. Many of those products
are based on the low volatility we’ve seen, which is inarguable on the index
level.”
“Technically, the best thing
that stocks have going for them is momentum. When it reaches the level
it’s at, it becomes a powerful force that can continue for weeks or more. There
is significant deterioration under the surface of this momentum, so it’s on a
shaky foundation and is more likely to fail than if there were more supports.
By the time it gets to this stage, we’re usually at the “weeks, not months”
part of the cycle. It doesn’t say much about prospects for longer-term
investors, but those with a more medium time frame should be on guard. When
gains get this easy, it’s usually about to become much less so.”
As everyone knows, a handful of Megacap tech
stocks have led the rally over the last two years. Any mention of adding AI
to a big tech company’s product line (e.g. Apple announcing AI capabilities to
be offered in a future iPhone) causes an immediate stock price pop. That’s
despite there is no assurance if that AI capability can ever be monetized???
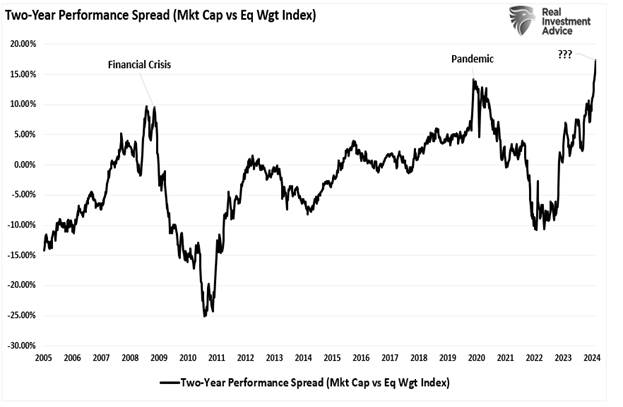
The spread in performance between the cap weighted
S&P 500 (SPY ETF) vs. the equal weight S&P (RSP ETF) is at the highest
level since the “COVID pandemic” and higher than it was at the peak of the
market heading into the “Financial Crisis.” That’s clearly a sign for caution.
Conclusion and End Quote:
Momentum-driven markets can
last longer and go further than anyone can predict.

John Maynard Keynes famously observed that “markets can stay
irrational for longer than you can stay solvent.”
................................................................................................
Be well,
stay calm, success, and good luck. Till next time…..
The Curmudgeon
ajwdct@gmail.com
Follow the Curmudgeon on Twitter @ajwdct247
Curmudgeon is a retired investment professional. He has been involved in financial markets since 1968 (yes, he cut his teeth on the 1968-1974 bear market), became an SEC Registered Investment Advisor in 1995, and received the Chartered Financial Analyst designation from AIMR (now CFA Institute) in 1996. He managed hedged equity and alternative (non-correlated) investment accounts for clients from 1992-2005.
Victor Sperandeo is a historian, economist and financial innovator who has re-invented himself and the companies he's owned (since 1971) to profit in the ever changing and arcane world of markets, economies, and government policies. Victor started his Wall Street career in 1966 and began trading for a living in 1968. As President and CEO of Alpha Financial Technologies LLC, Sperandeo oversees the firm's research and development platform, which is used to create innovative solutions for different futures markets, risk parameters and other factors.
Copyright © 2024 by the Curmudgeon and Marc Sexton. All rights reserved.
Readers are PROHIBITED from duplicating, copying, or reproducing article(s) written by The Curmudgeon and Victor Sperandeo without providing the URL of the original posted article(s).